Hi there... I'm
Godfried Junio Matahelemual
Data Scientist, Data Analyst, Business Intelligence Analyst, GIS
Analyst

Hi there... I'm
What I do
Examine data sets to find trends, provide insights, and draw conclusions about the information they contain.
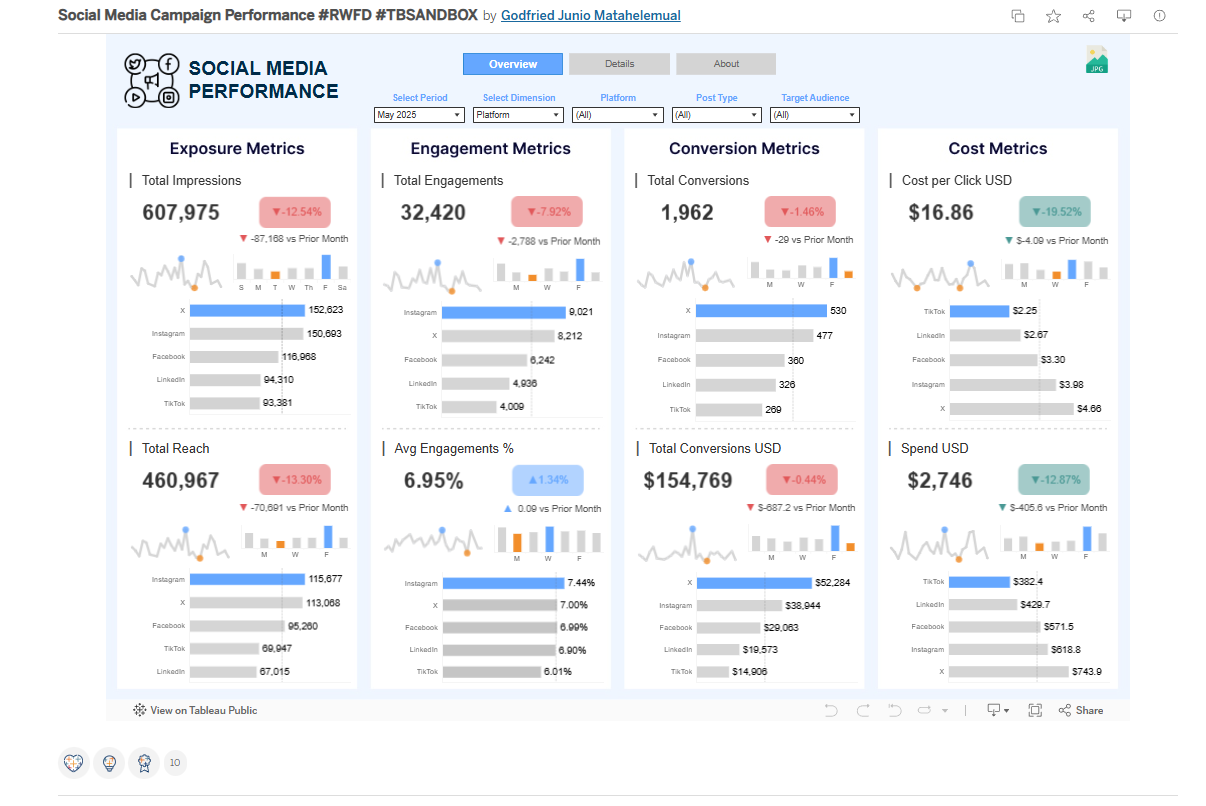
Translate data sets and metrics into charts and other visuals to deliver insights for supporting decision making.
Perform predictive analytics using machine learning to help businesses make better data driven decisions.
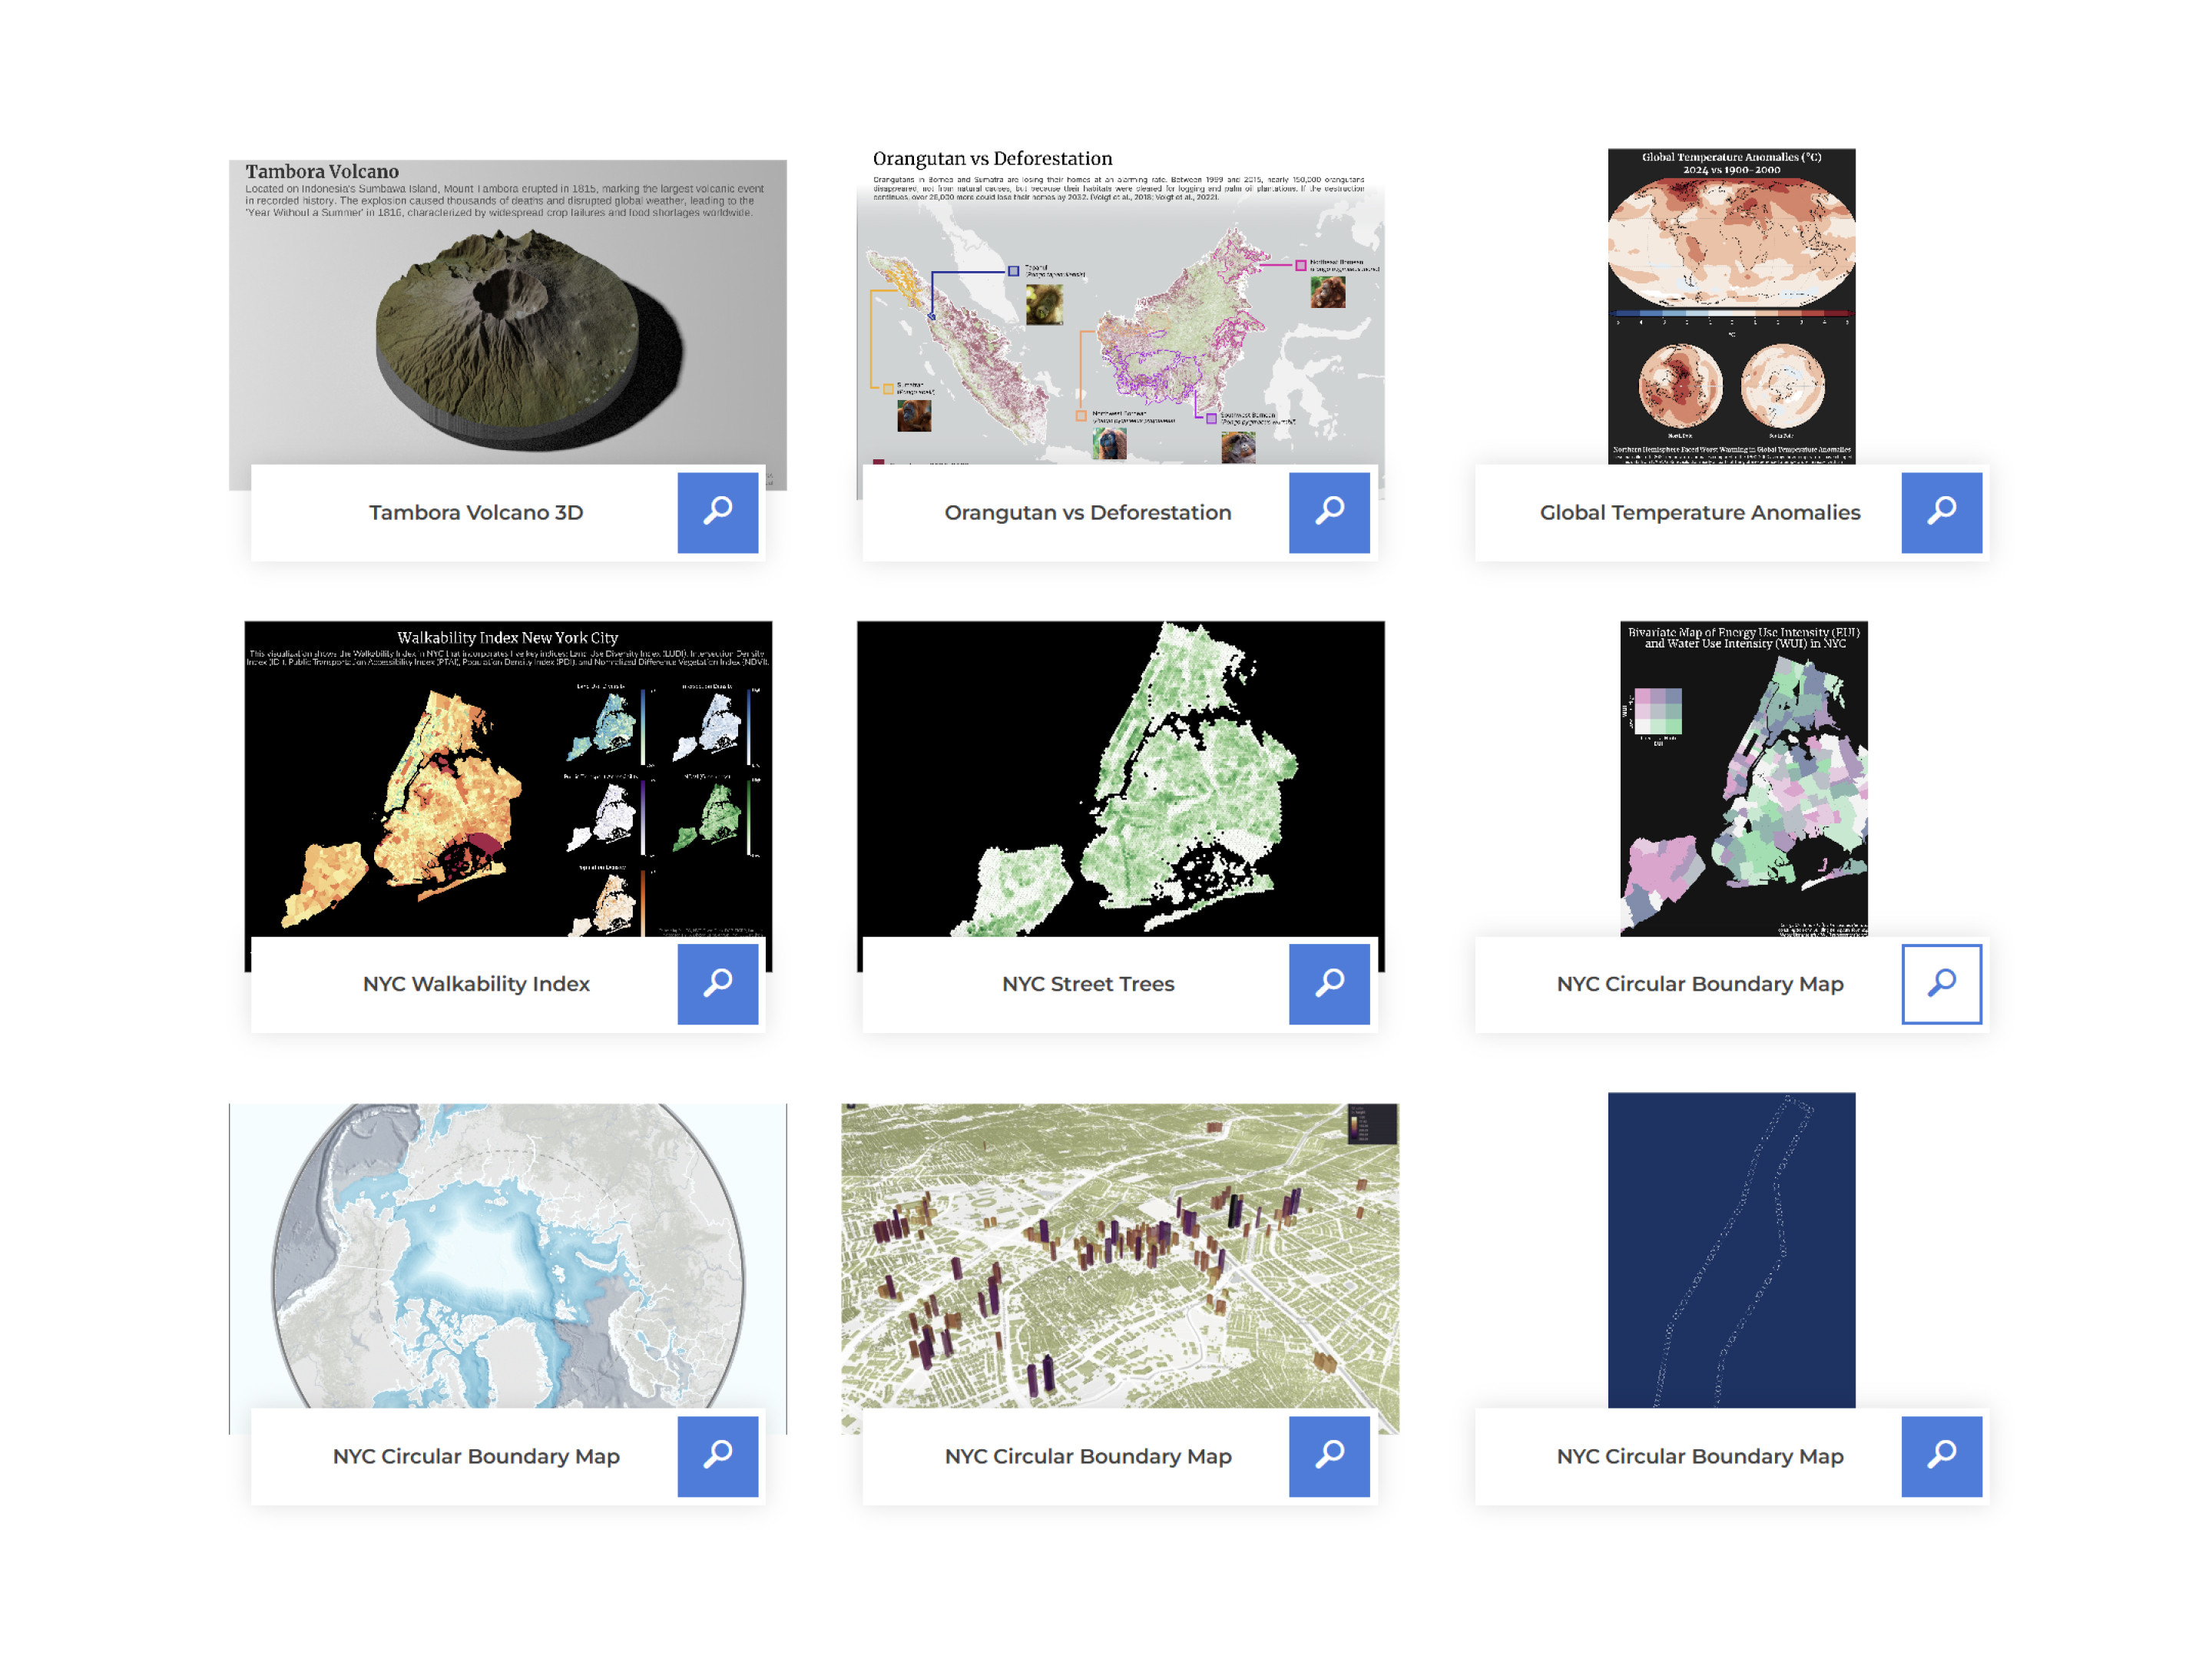
Perform geo-related data analysis and location intelligence services.
My Resume
My Portfolio
Activity
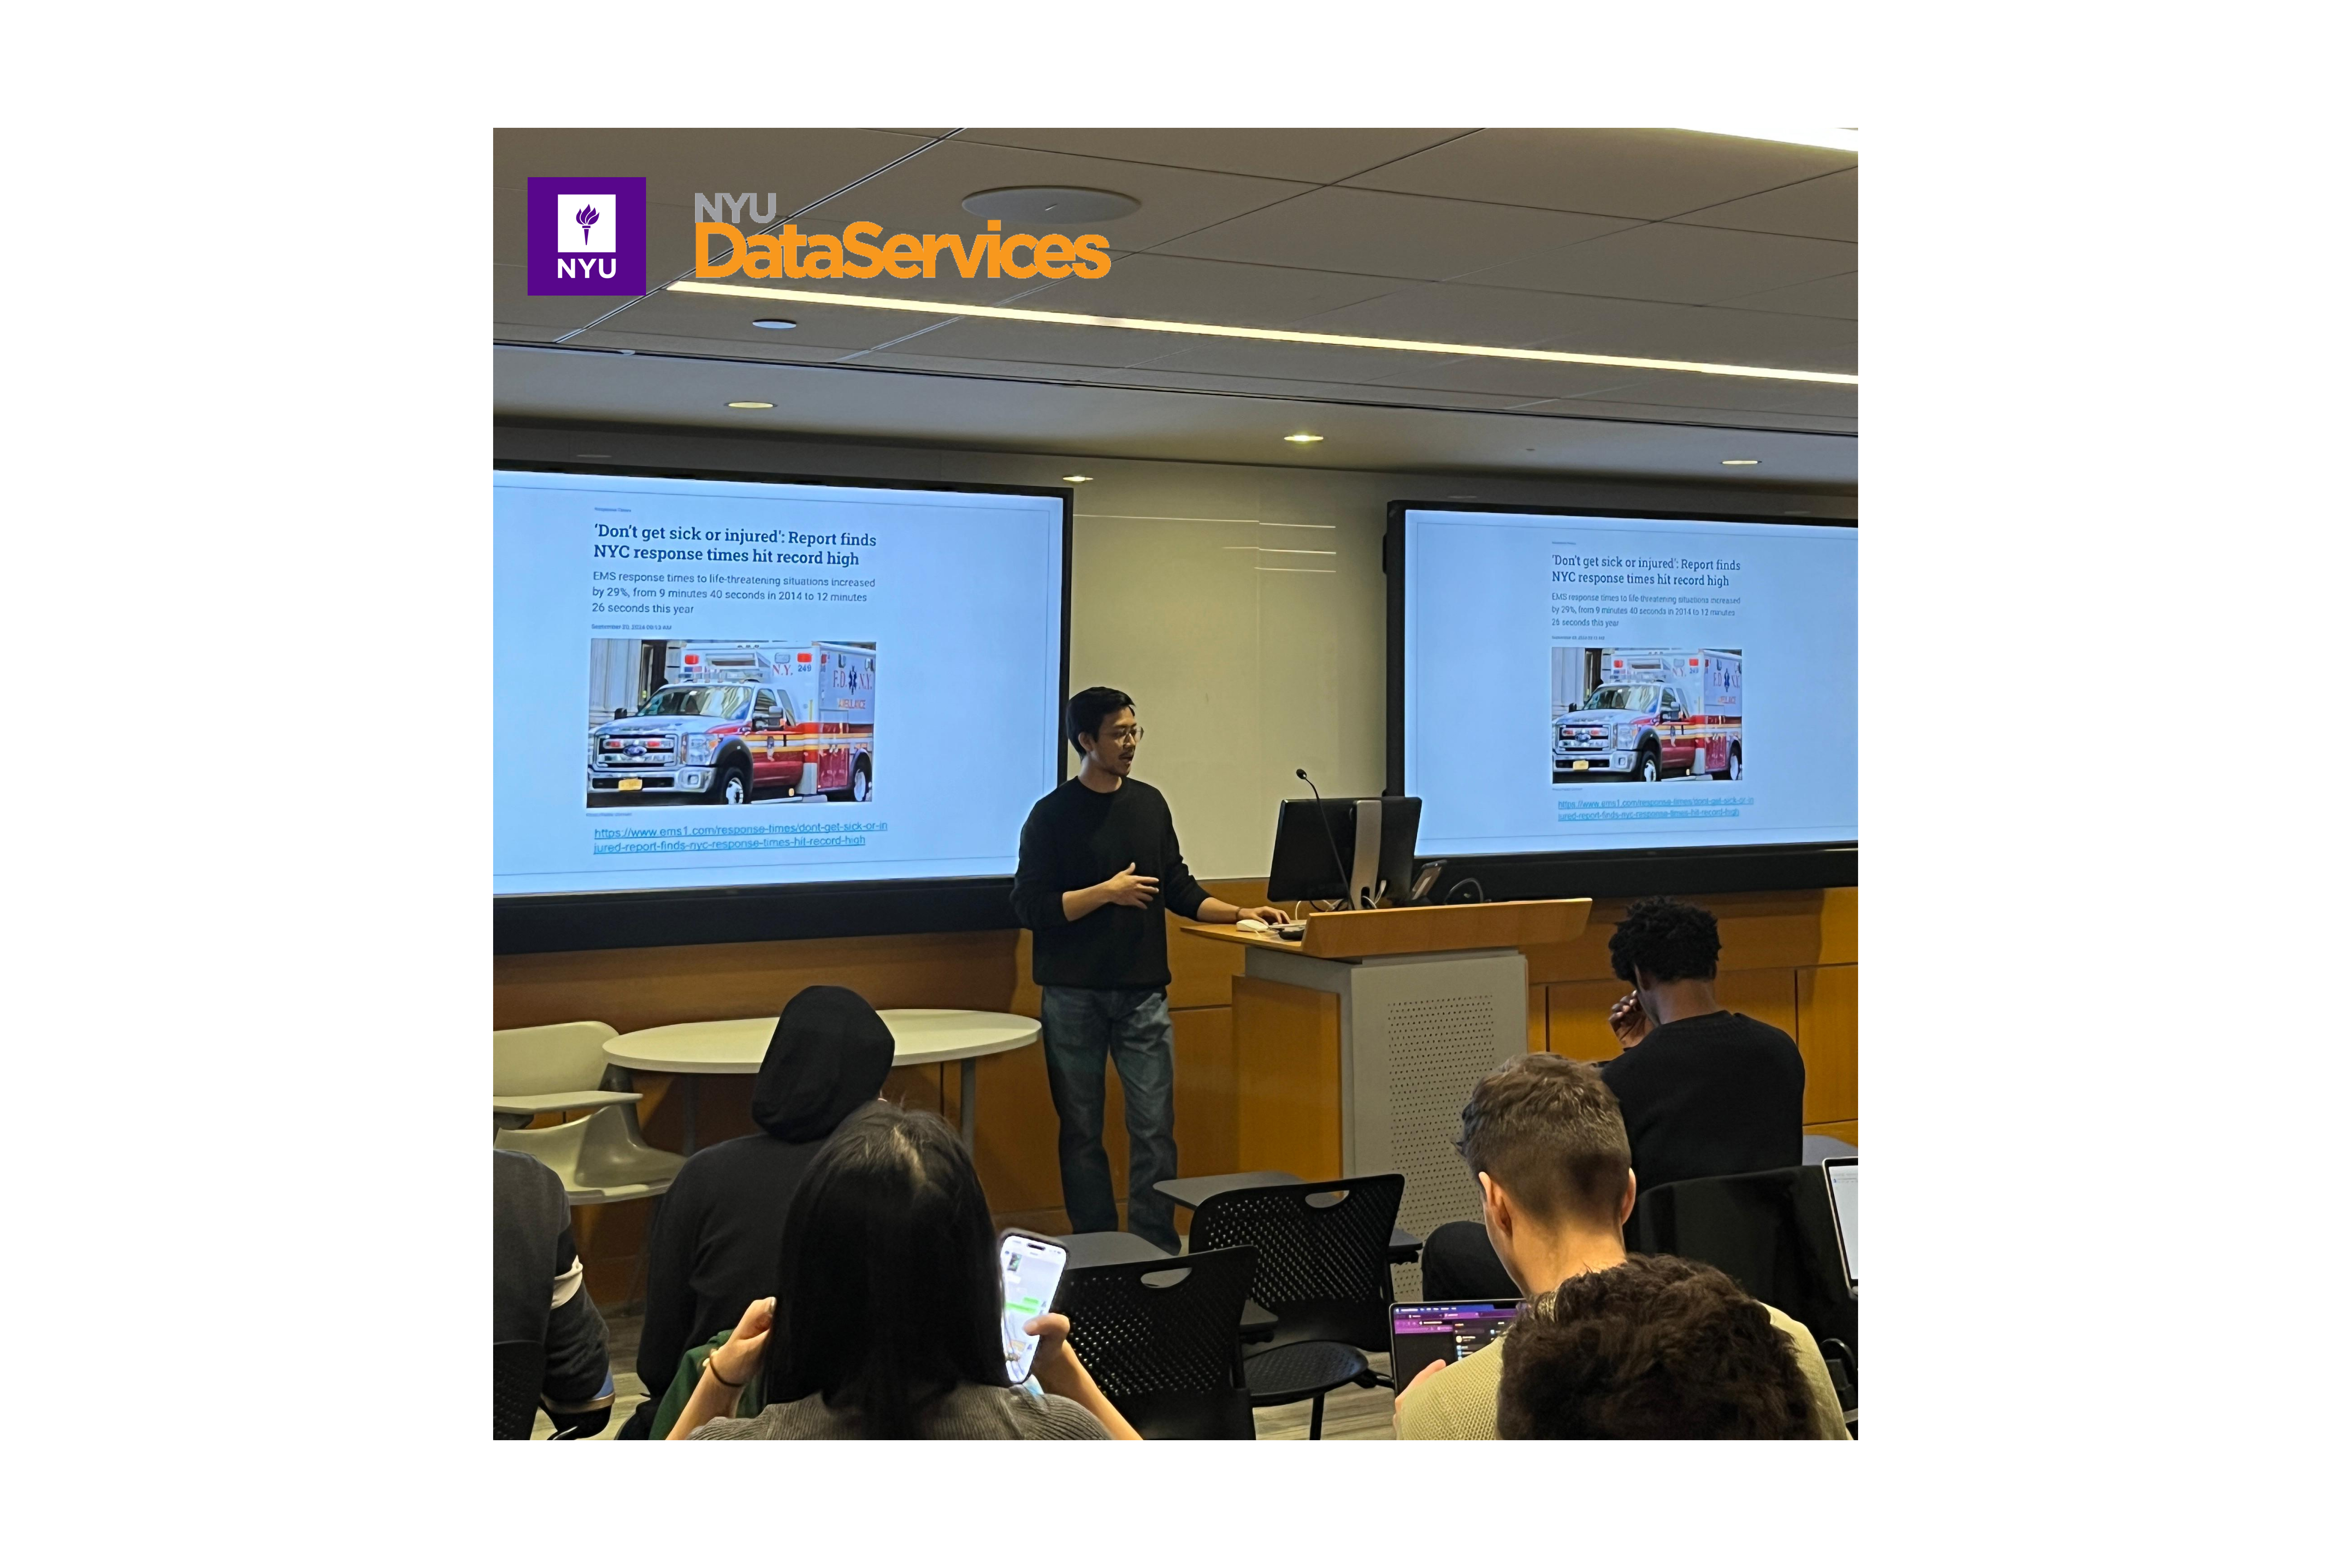
Celebrate the power of maps and location data at NYU GIS Day 2024 on November 20th!
This year’s theme - 'Mapping Minds, Shaping the World' - is all about how GIS technology is
reshaping our world by blending creativity and data to reveal hidden trends, drive sustainability,
and make smarter decisions using the power of location data. (gisday.com). Whether you're new to GIS
or a seasoned professional, there's something for everyone!
Learn how to use ArcGIS Online to performing geospatial analysis.
📅 Nov 2024
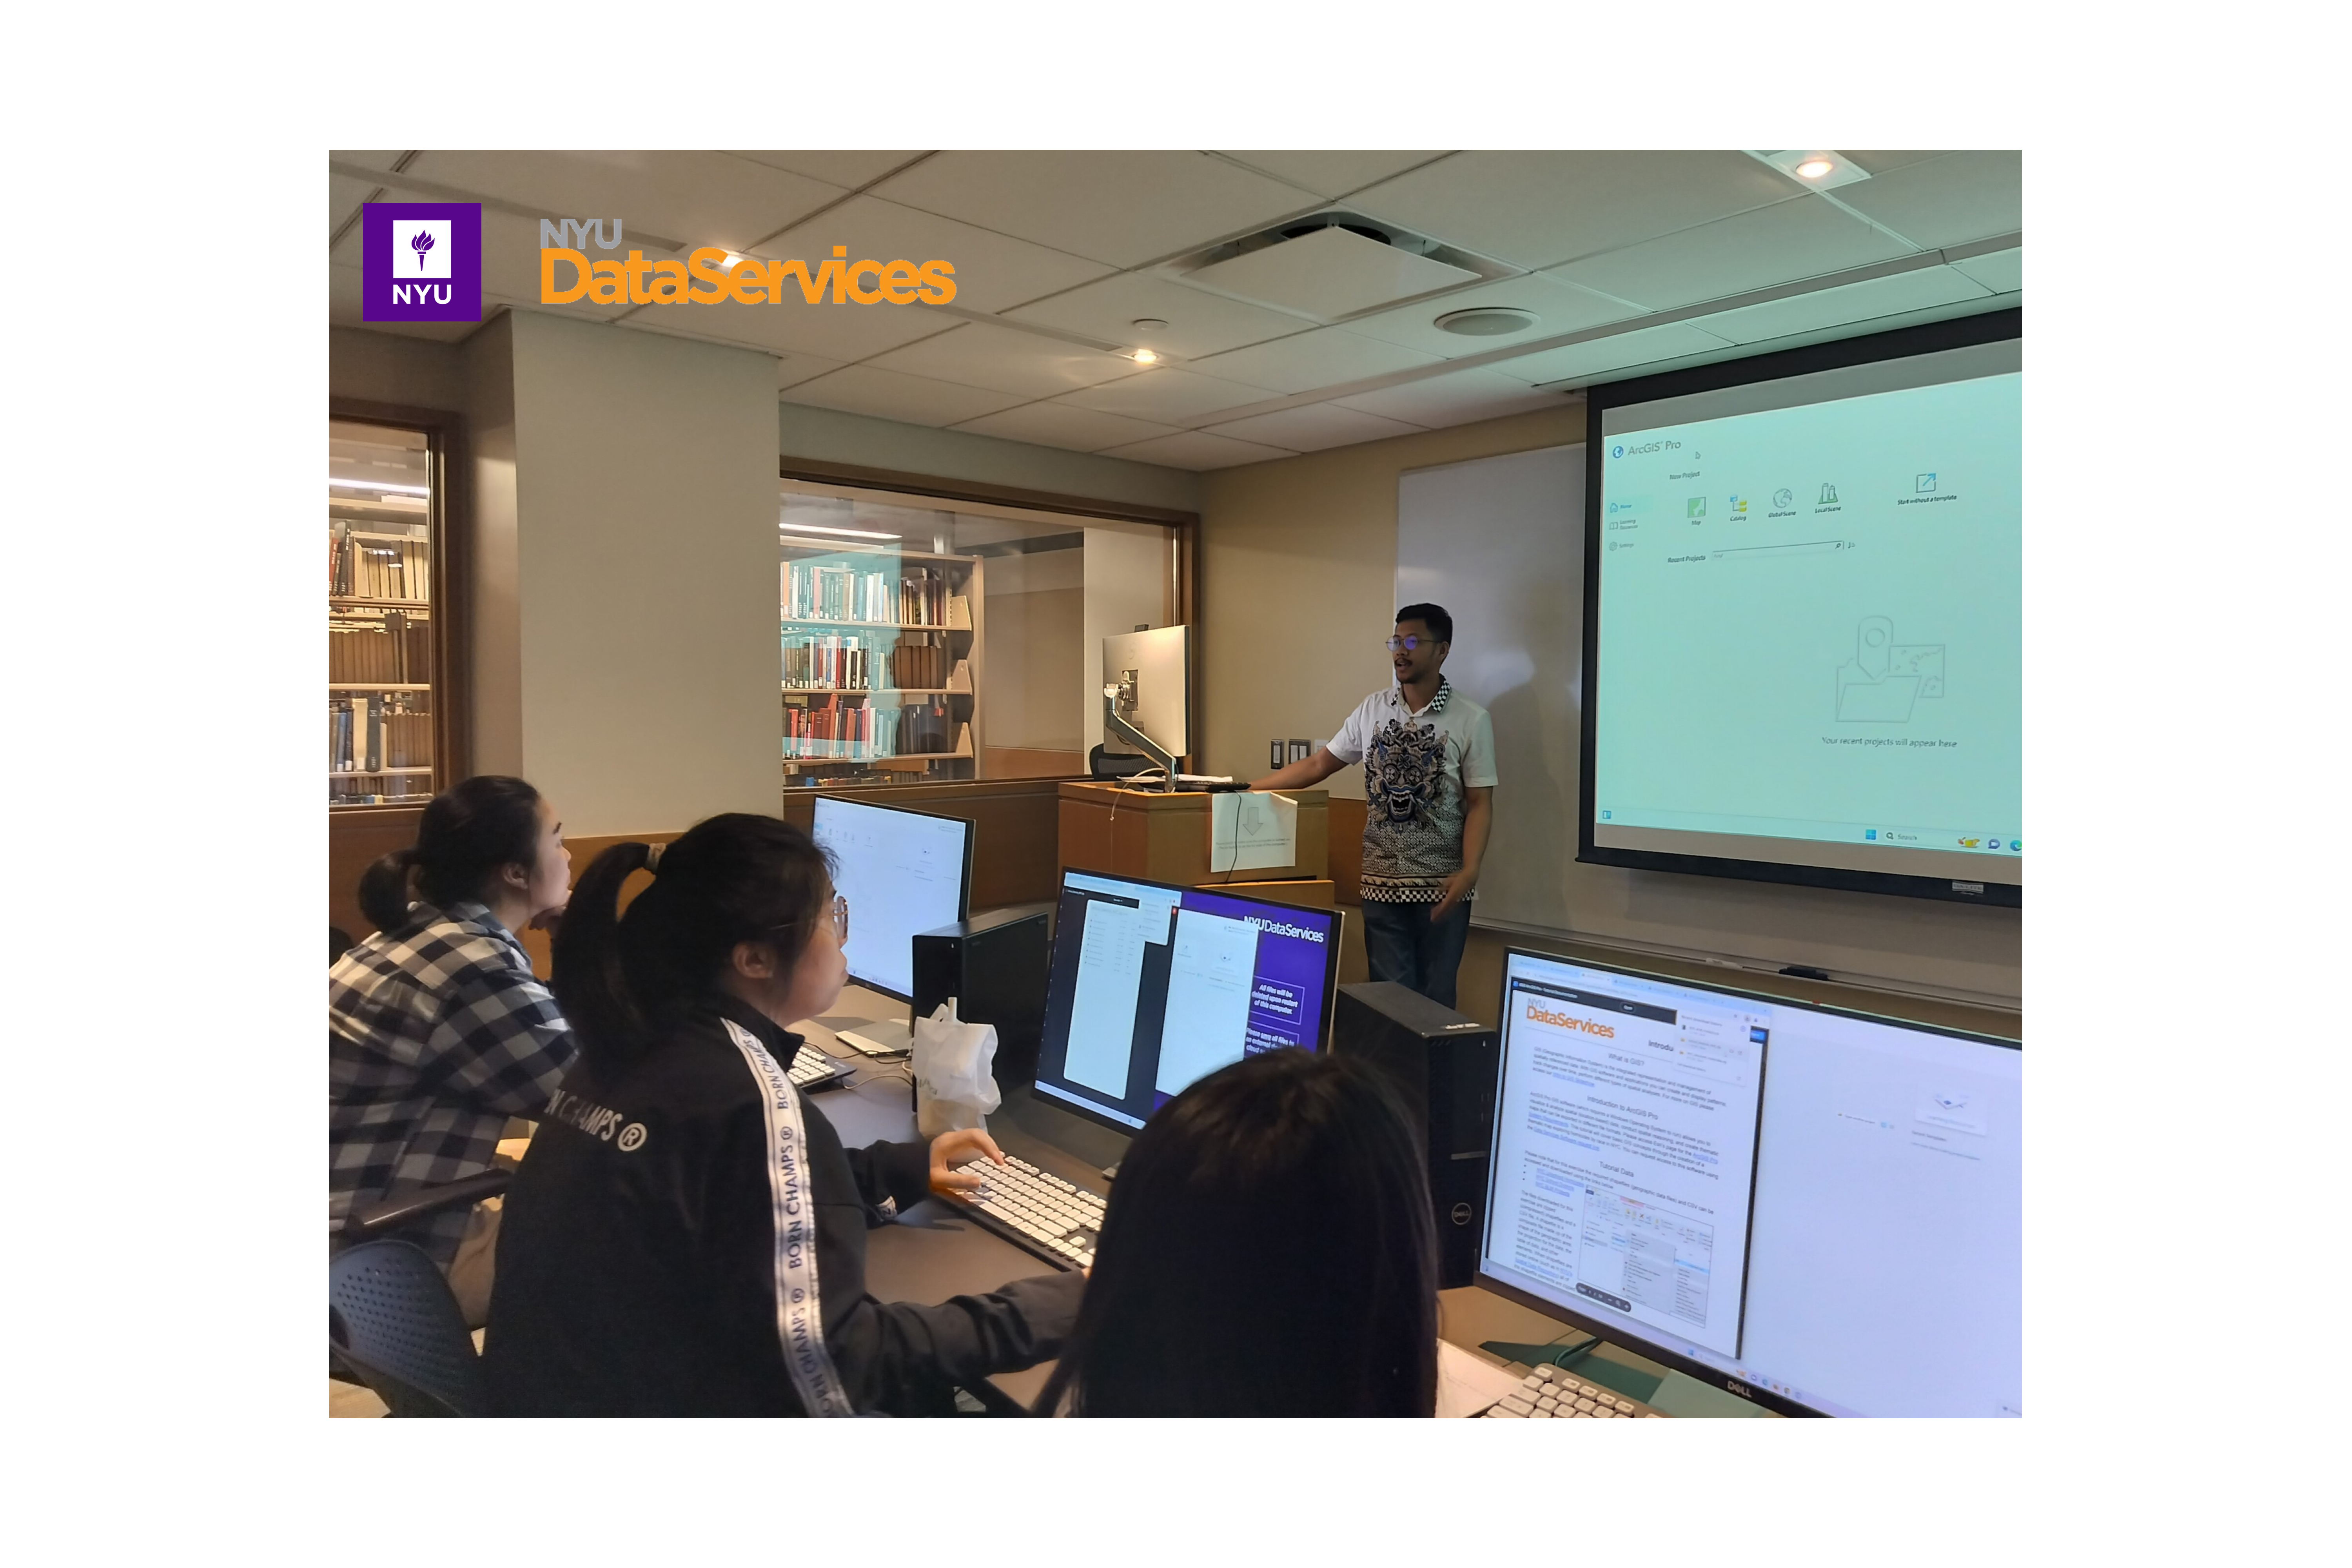
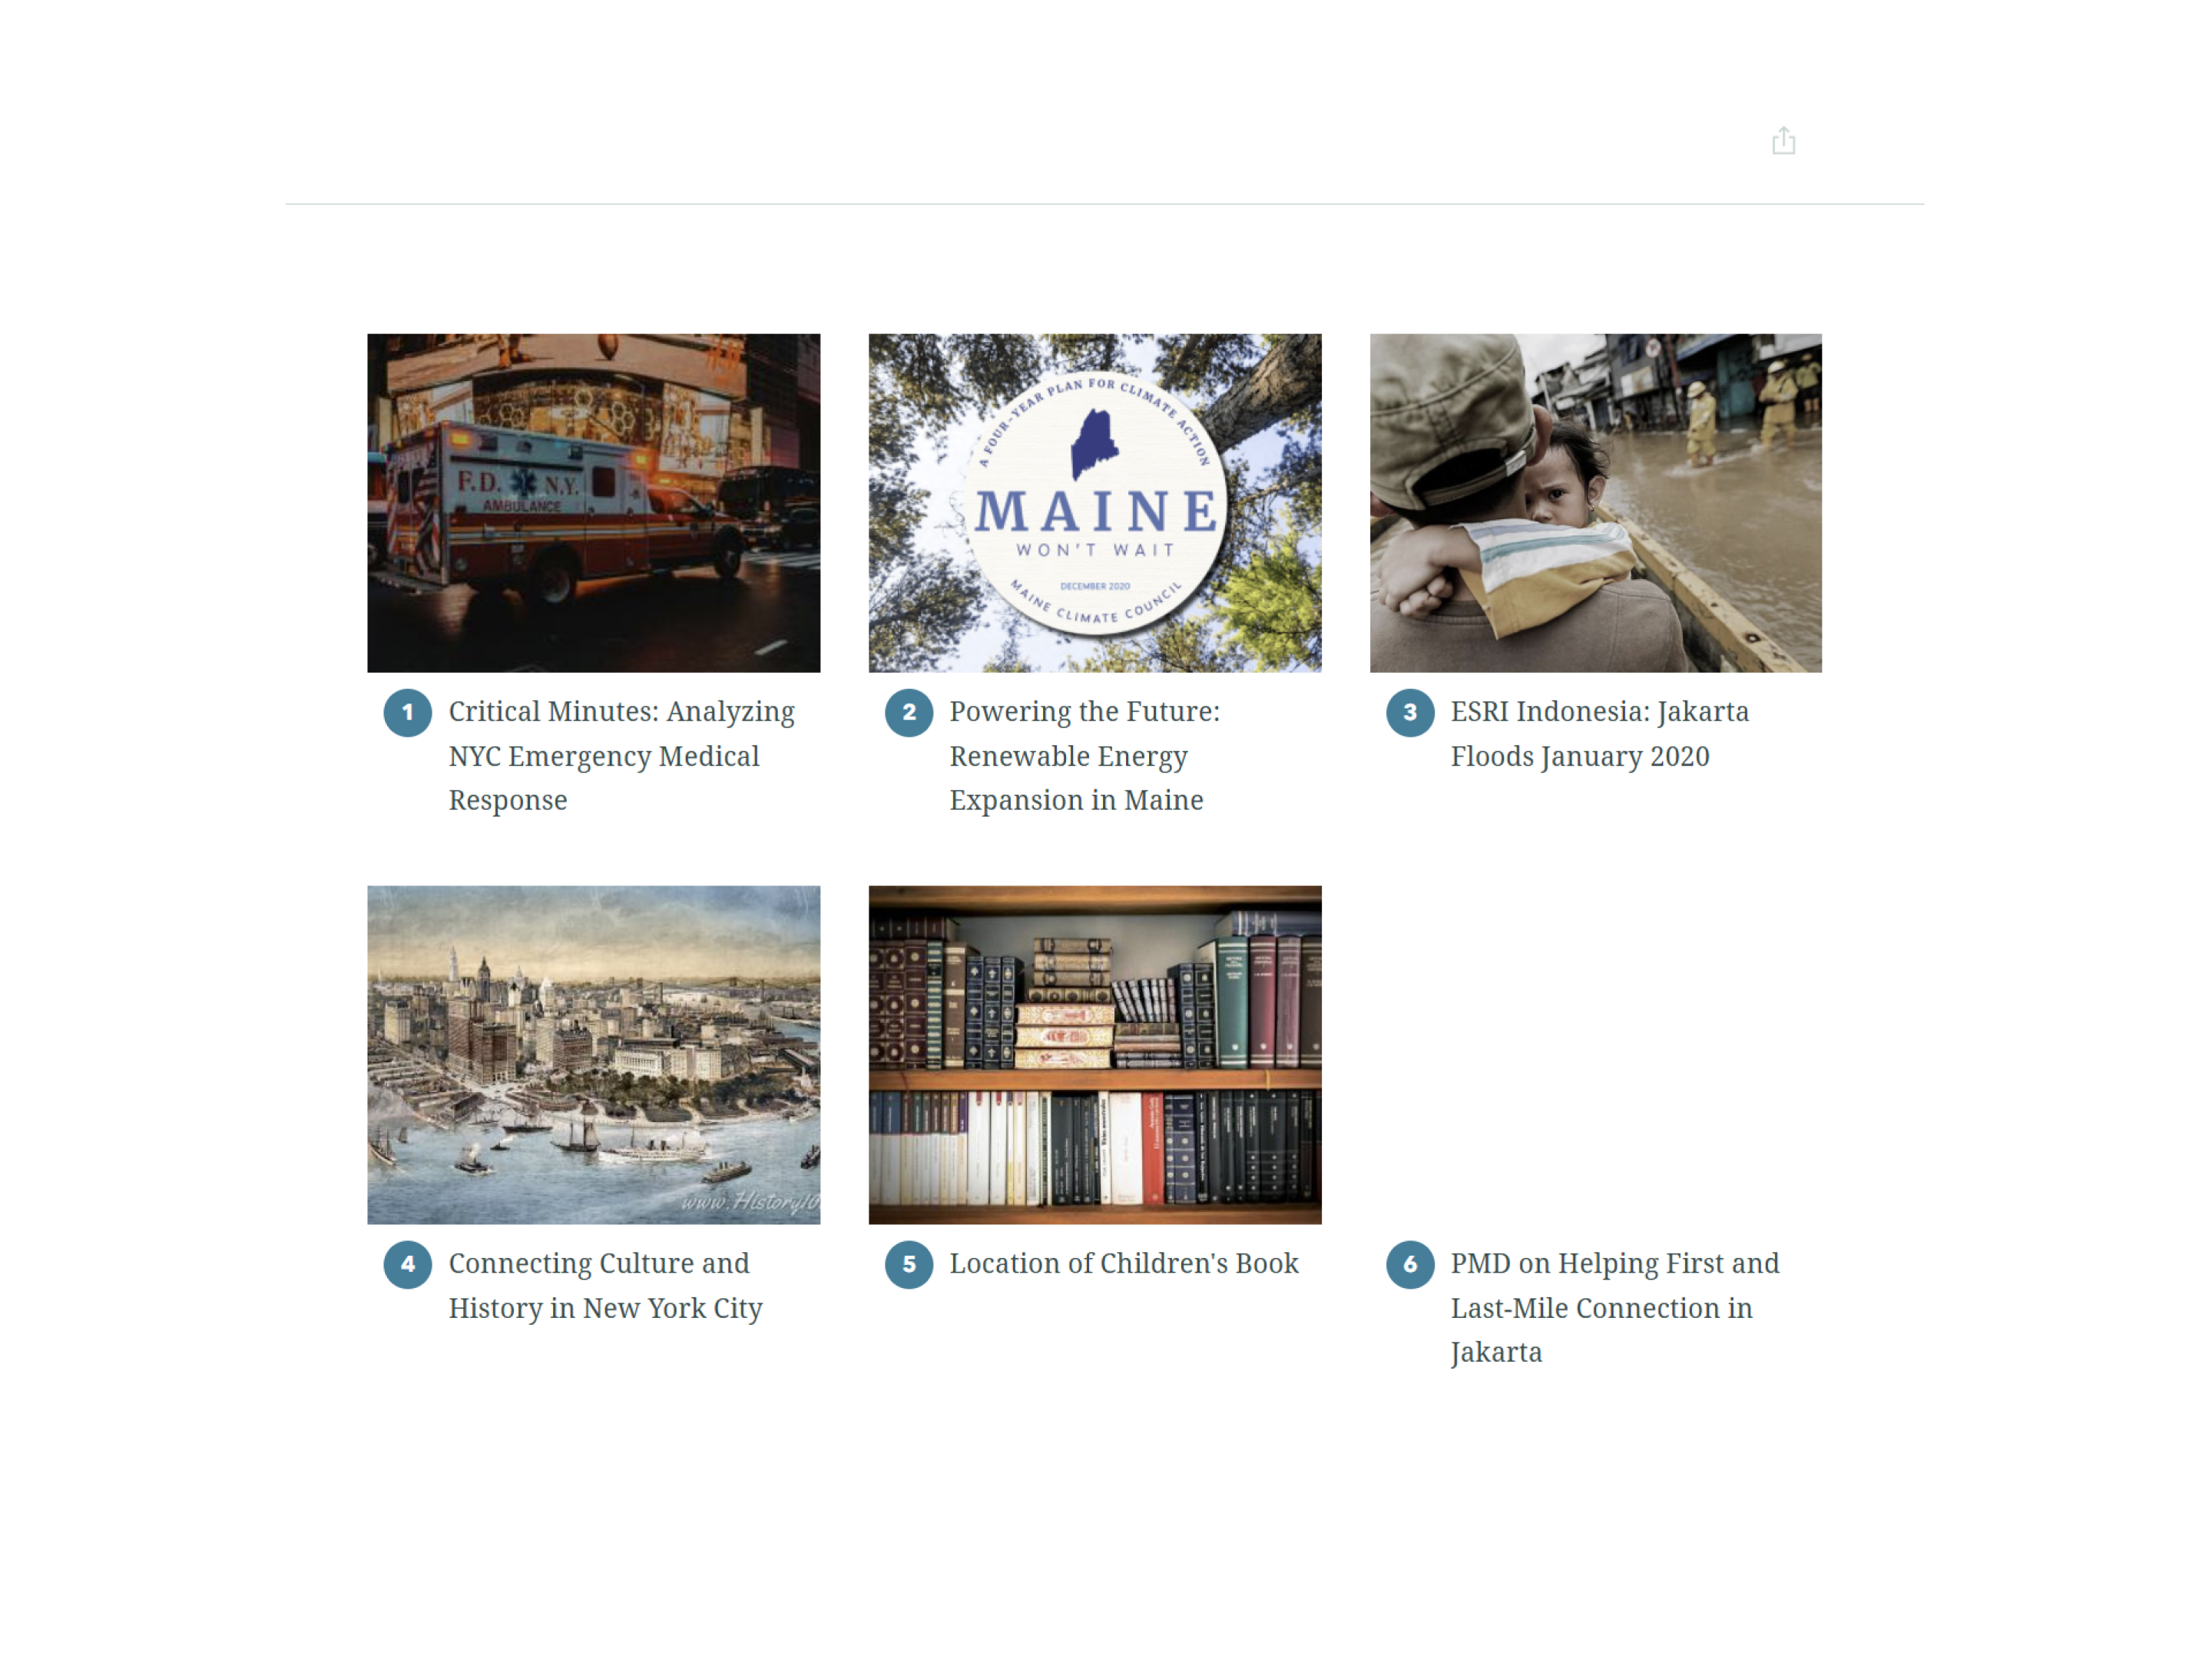
The Foundations of Research Computing (FORC) Camp is a three day data skills
immersion program offered to Arts & Science Master’s College students by Data Services
(NYU Libraries and IT) in collaboration with the Arts & Science Office of Teaching Excellence and Innovation.
FORC will give participants a thorough grounding in the digital skills essential for their research.
There is something for every disciplinary approach, from creating visualizations that require no coding
skills to data harvesting and statistical analysis.
📅 Aug 2024
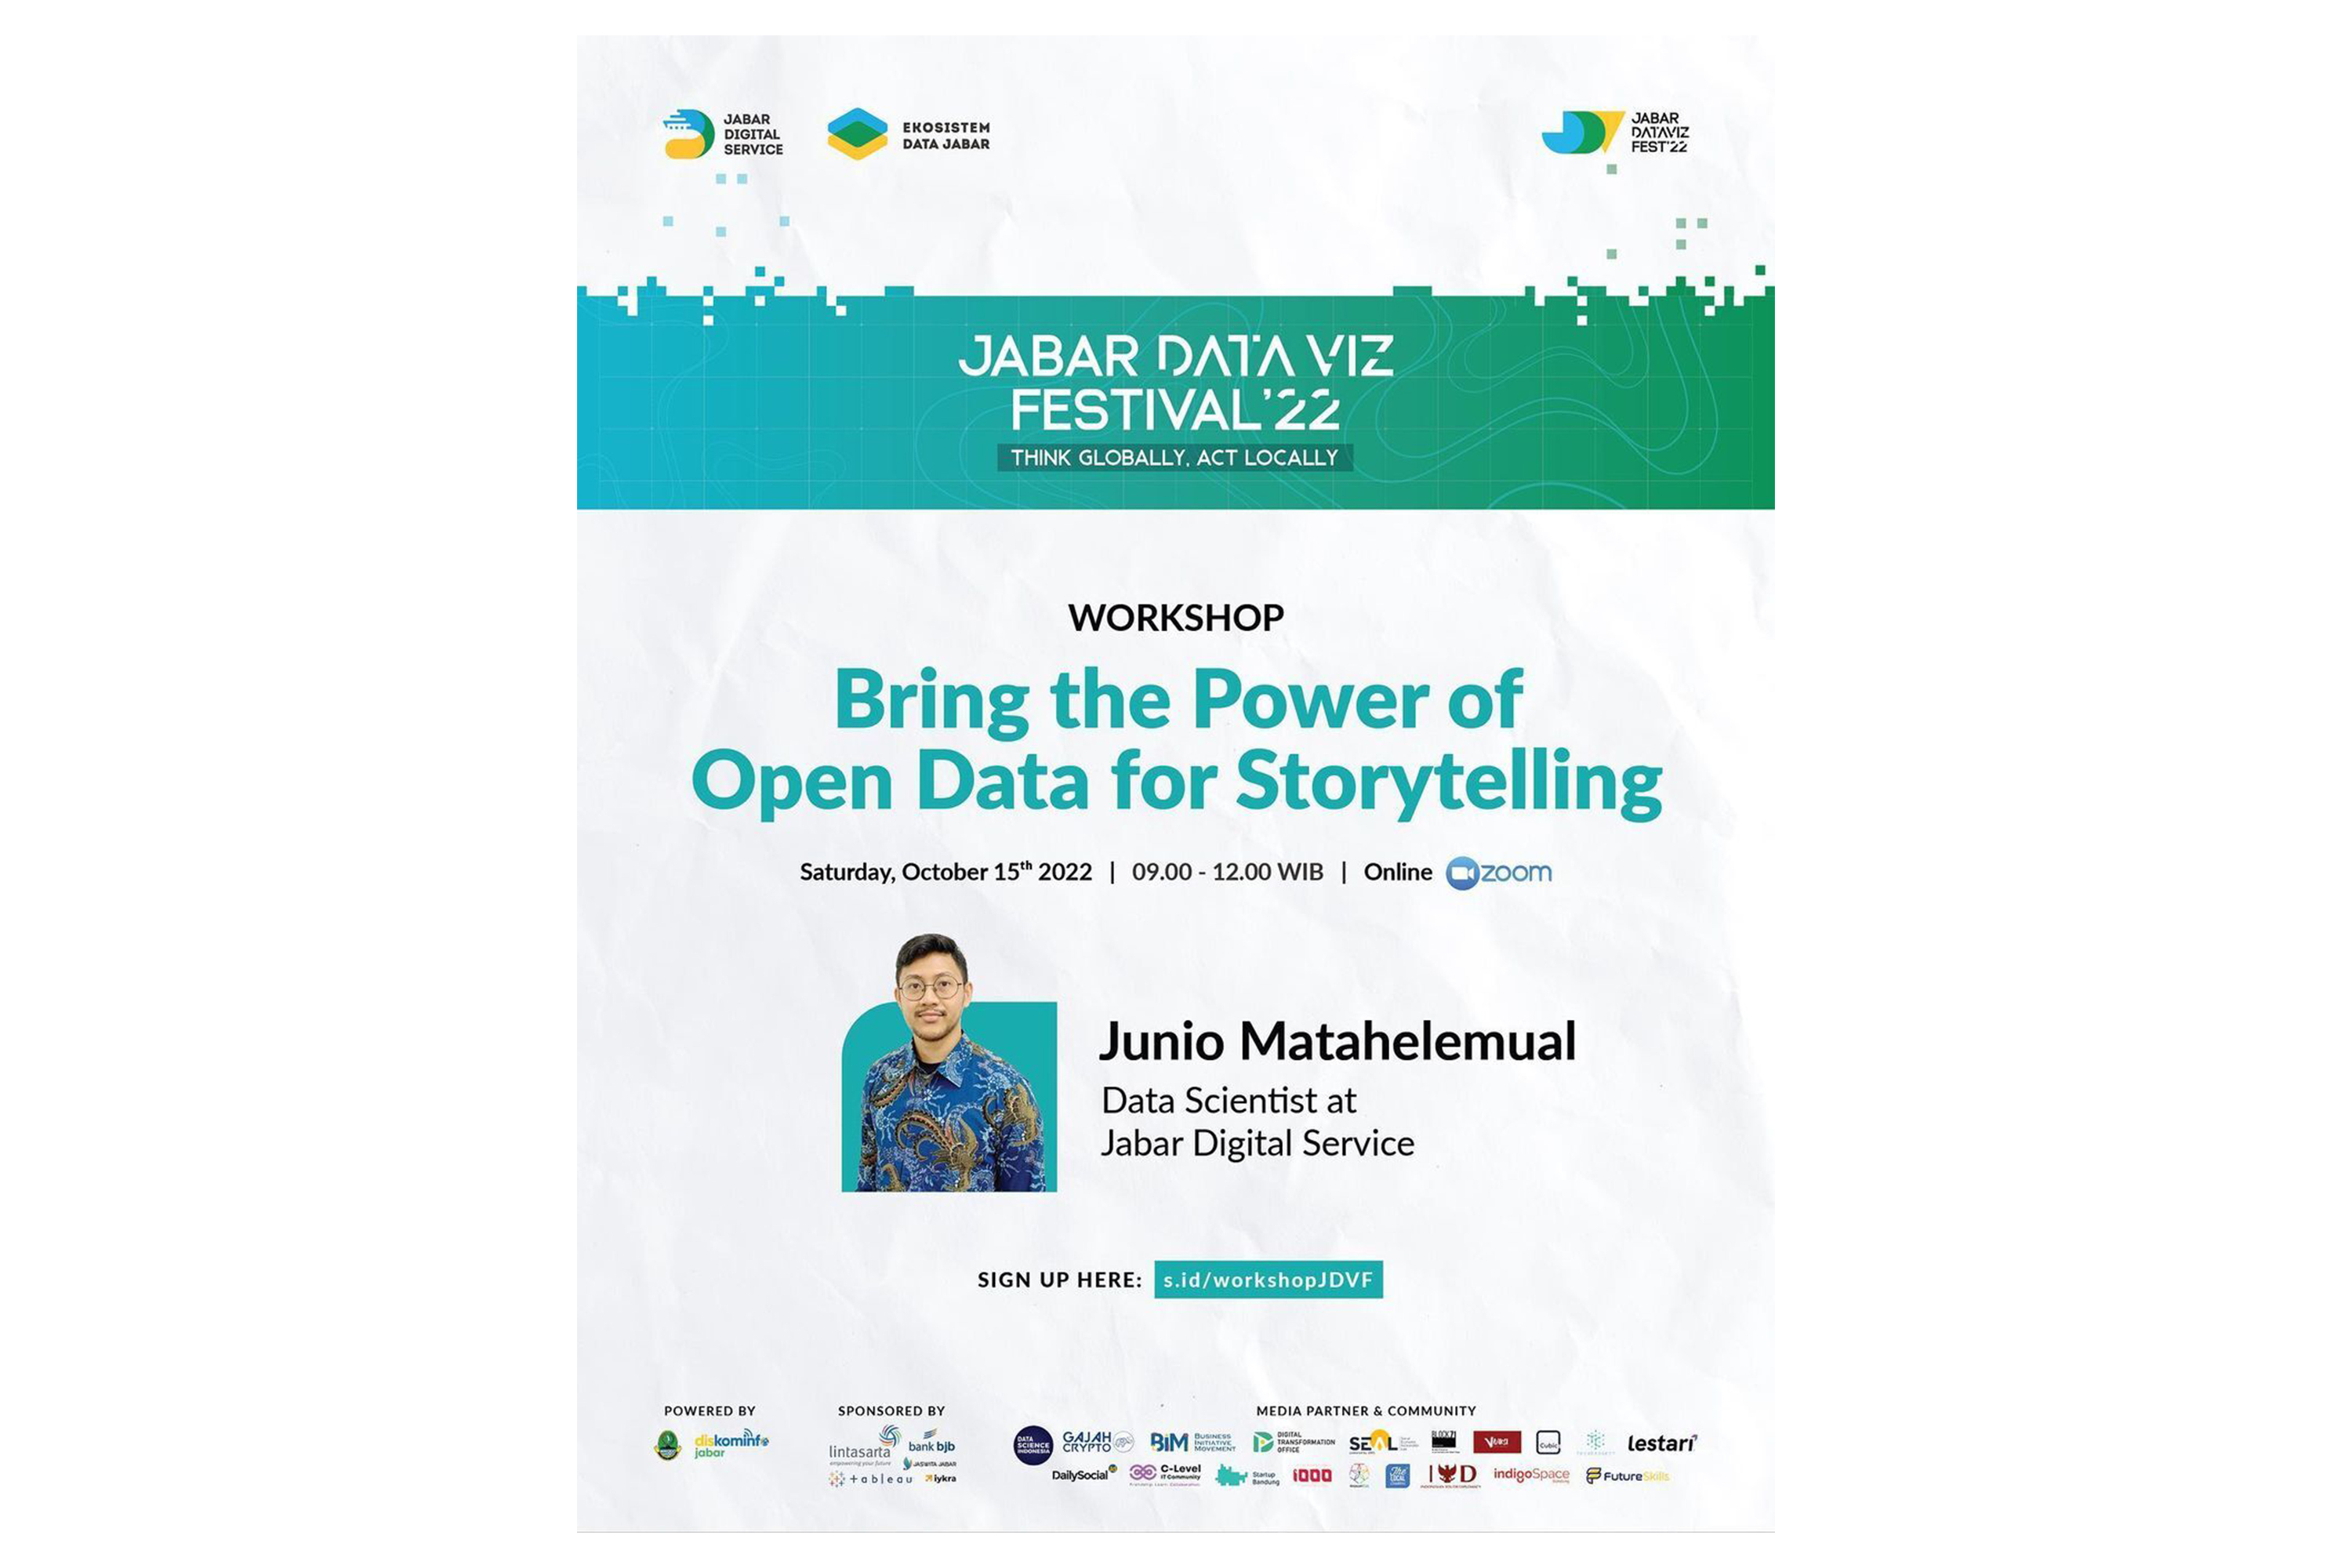
Data storytelling is the art of using narratives/stories to convey messages, information, and insights into data.
In addition, data storytelling can also strengthen the insights generated from the data visualizations that you create.
In this workshop, Junio Matahelemual as a Data Scientist at Jabar Digital Service will cover core data storytelling
lessons in depth and guide you to put them immediately into hands-on practice. You will learn how to plan a storytelling
dashboard using storyboard and implement the plan to the dashboard using Tableau Public as BI Tool.
📅 Oct 2022
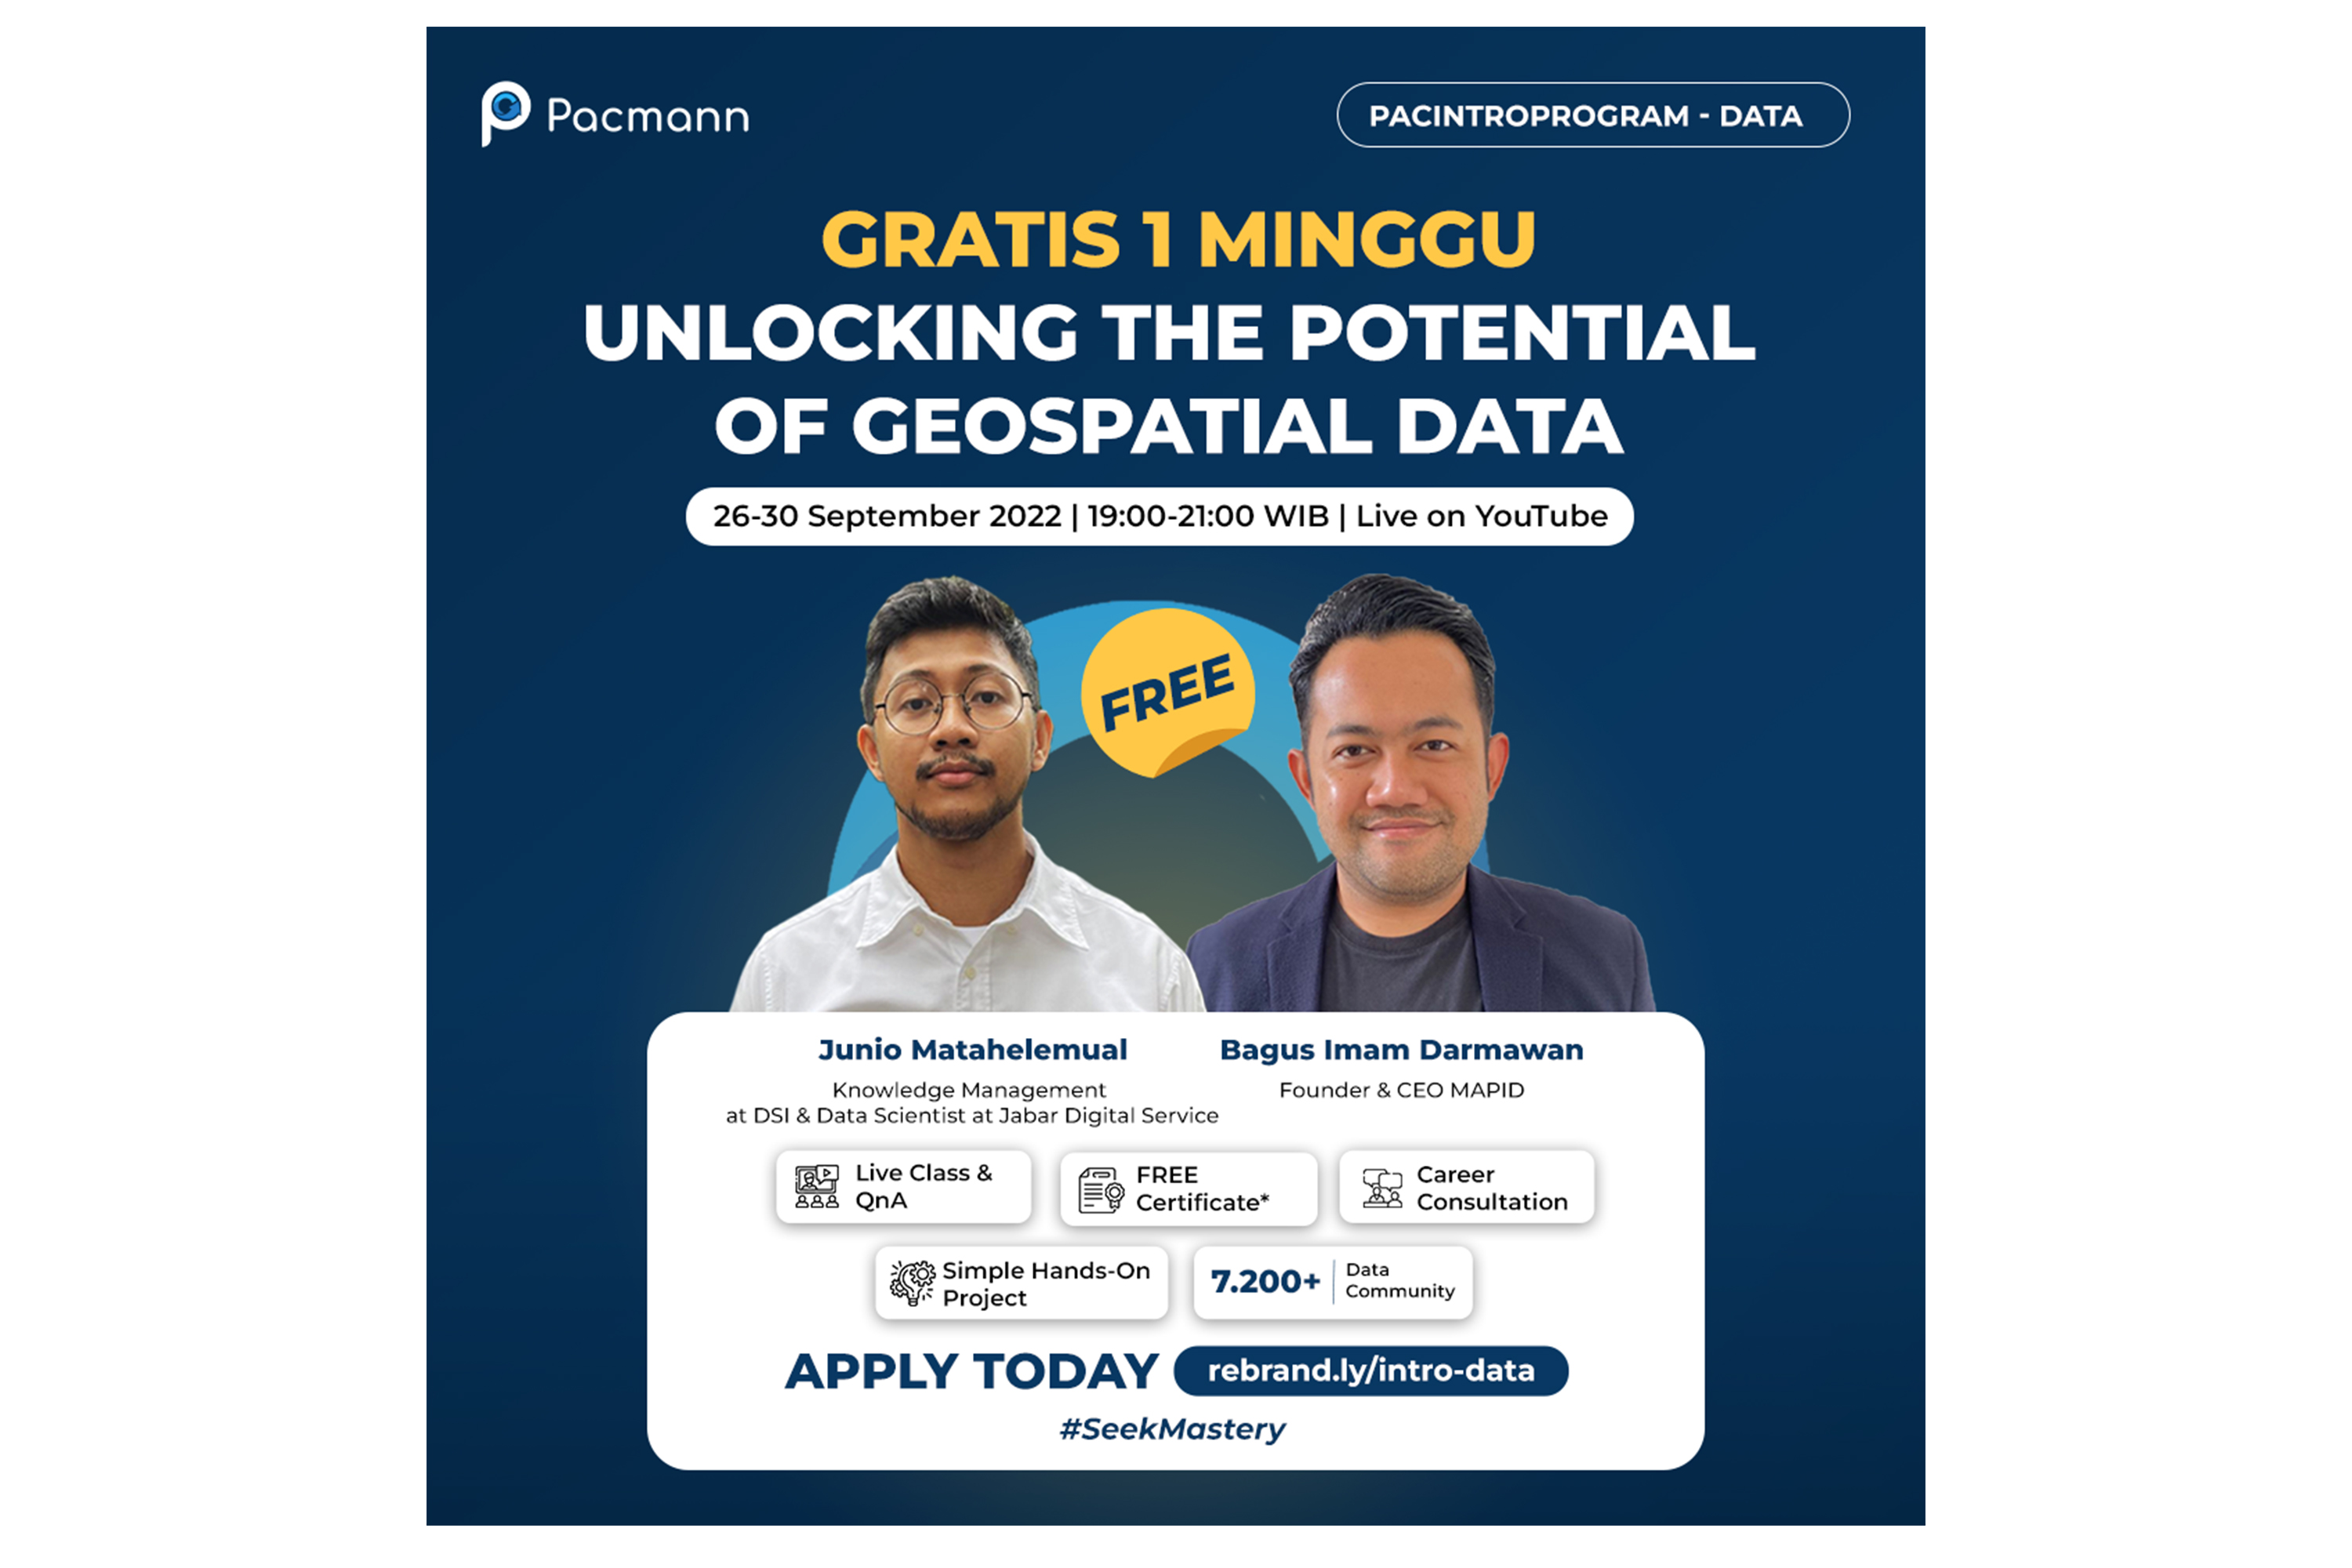
Introduction to Pacmann Data and Analytics is a series of preparatory classes for
Pacmann
Skill
Upgrader Program
enthusiasts or Pacmann Career Upgrader Program enthusiasts.
In this Intro to Data program: "Unlocking the Potential of Geospatial Data" the audience
will learn
and understand techniques for
effectively visualizing geospatial data and building analytical dashboards for
location-based
decision making.
📅 Sept 2022